Collecting and Dashboarding Customer Purchase Data from a Famous E-commerce Website
Digikala is an popular Iranian e-commerce company I personally buy a lot from them and in this project I tried to create a dashboard to analyze my purchases.
Project Overview :
1 - Collecting Data :
I used Digikala's hidden api to collect data, fortunately Digikala uses api to load data and I didn't have much trouble collecting data (There was no scraping :) )
What data did I collect ?
Orders data
id
payable_price
created_at
total_cost
shipping_cost
discount
purchased product data
id
order_id
created_at
title_fa
title_en
image_url
category
2 - Preprocess and Feature engineering collected data :
Convert order date from Jalali to Gregorian
Clean category text
save datas into csv
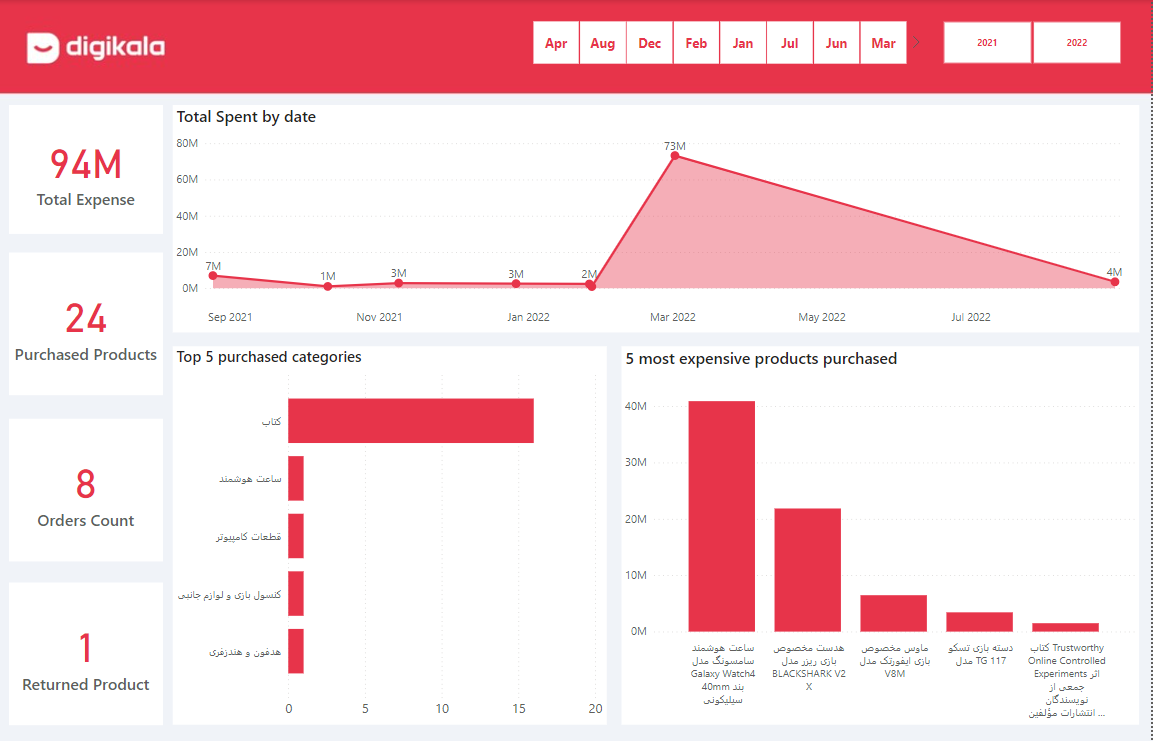
3 - Creating the dashboard using Power BI
For creating dashboard i used Power BI an powerful tool and interactive data visualization software product developed by Microsoft
What i persented in my dashboard :
Note: that all the monetary units presented in this dashboard are in Rials
Total Expense (Collection of money spent in Digikala)
Purchased Products (Number of products purchased)
Orders Count (Number of times ordered)
Return Products (Number of products purchased and returned)
Total Spent by date (Total spent by year and month)
Top 5 purchased categories (Which categories were the most purchased?)
5 most expensive products purchased (The most expensive products bought)


