Customer Segmentation and Behavioral Analysis in a Retail Company
Link of the project
Preview
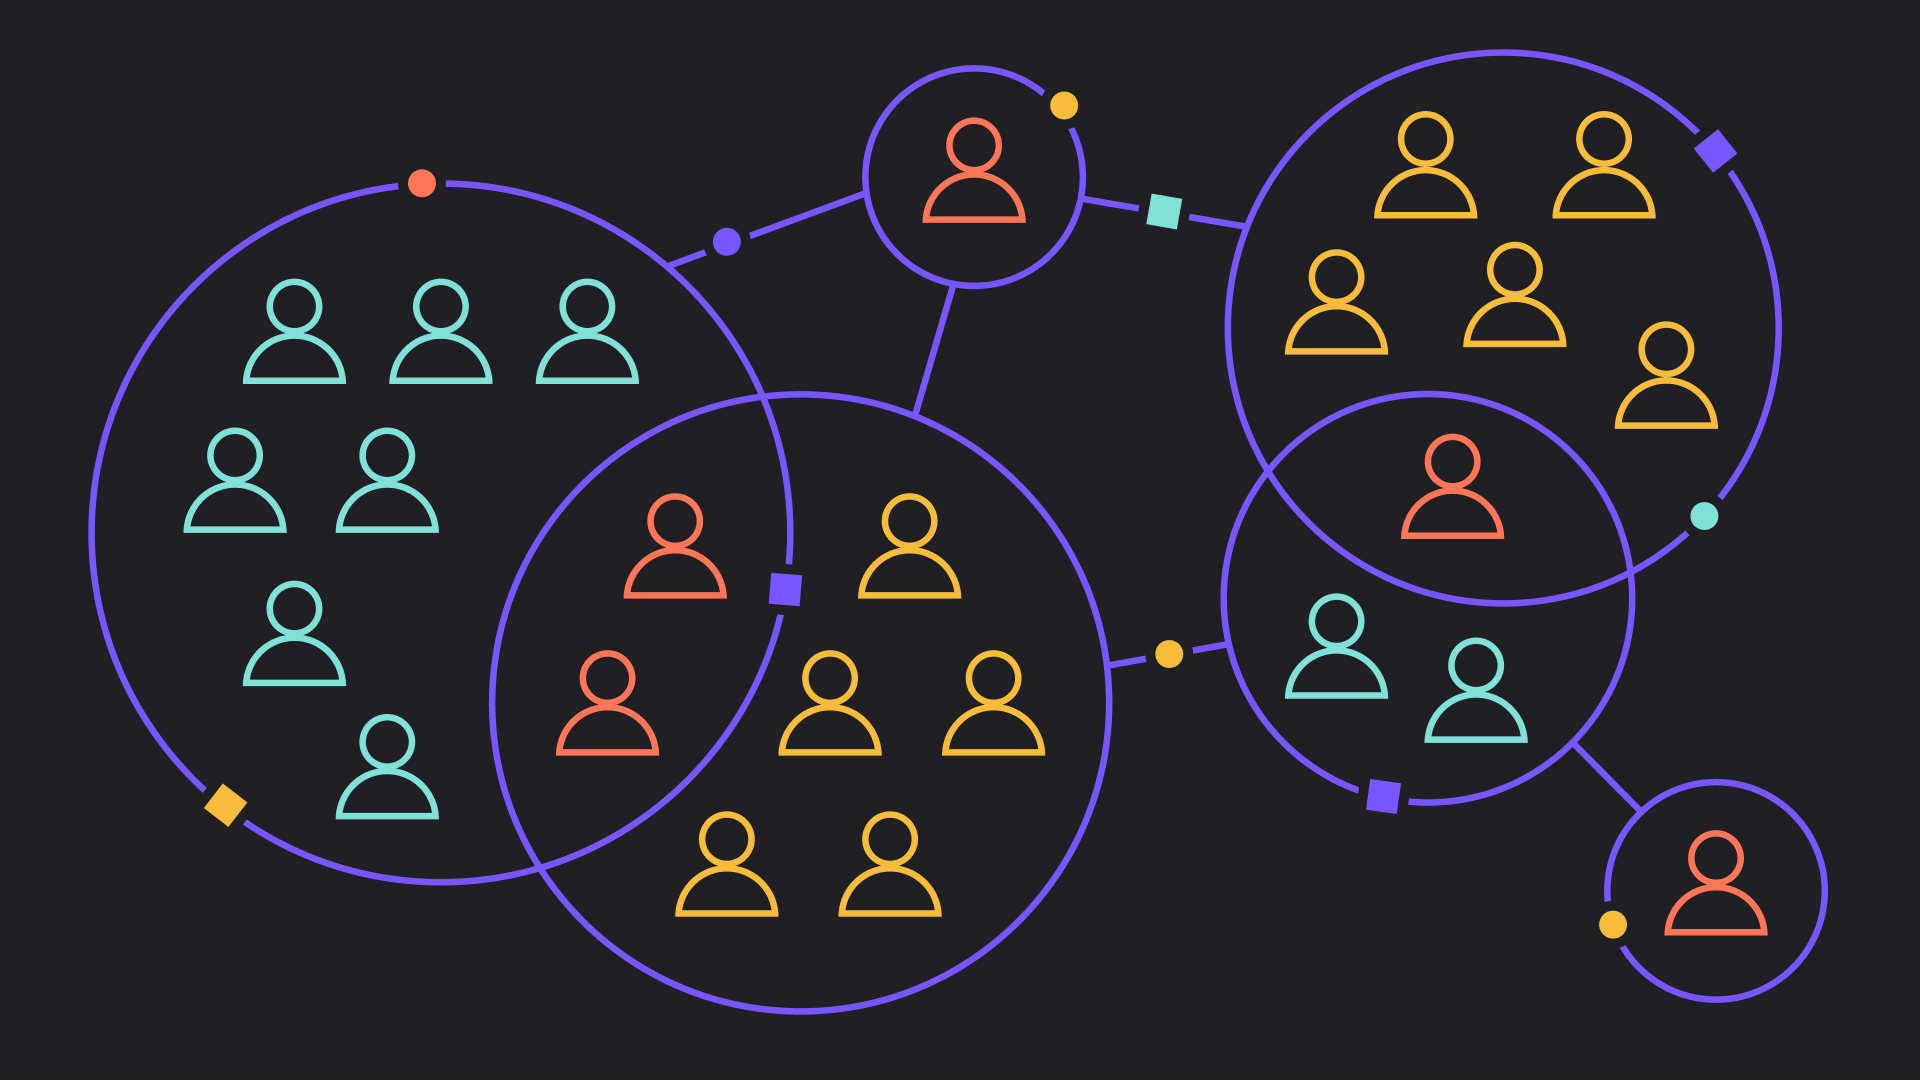
In this project, I aim to extract meaningful segments from the customer data of a grocery firm. These segments will assist the company in gaining a better understanding of customer behavior and similarities, enabling them to optimize their products and marketing strategies.
Clearilyfing Problem :
Business Objectives:
- What are the specific goals and key performance indicators tied to customer segmentation?
Application Focus:
- How will the segmentation findings be practically applied—product refinement, marketing enhancement, or both?
Product and Marketing Emphasis:
- Are there specific products, promotions, or marketing areas to focus on in the segmentation analysis?
User Behavior:
- Should the analysis prioritize current or historical user behavior, and are there specific behaviors of interest?
Demographics and Behavior:
- Should the segmentation prioritize demographics, behavior, or a balanced mix of both?
Collaboration:
- Is collaboration needed with other departments, such as marketing or product development?
What data do we have to solve the problem ?
customer profile data
ID: Customer's unique identifier
Year_Birth: Customer's birth year
Education: Customer's education level
Marital_Status: Customer's marital status
Income: Customer's yearly household income
Kidhome: Number of children in customer's household
Teenhome: Number of teenagers in customer's household
Dt_Customer: Date of customer's enrollment with the company
user behavoir data
Recency: Number of days since customer's last purchase
Complain: 1 if the customer complained in the last 2 years, 0 otherwise
marketing engagement data
Products
MntWines: Amount spent on wine in last 2 years
MntFruits: Amount spent on fruits in last 2 years
MntMeatProducts: Amount spent on meat in last 2 years
MntFishProducts: Amount spent on fish in last 2 years
MntSweetProducts: Amount spent on sweets in last 2 years
MntGoldProds: Amount spent on gold in last 2 years
Promotion
NumDealsPurchases: Number of purchases made with a discount
AcceptedCmp1: 1 if customer accepted the offer in the 1st campaign, 0 otherwise
AcceptedCmp2: 1 if customer accepted the offer in the 2nd campaign, 0 otherwise
AcceptedCmp3: 1 if customer accepted the offer in the 3rd campaign, 0 otherwise
AcceptedCmp4: 1 if customer accepted the offer in the 4th campaign, 0 otherwise
AcceptedCmp5: 1 if customer accepted the offer in the 5th campaign, 0 otherwise
Response: 1 if customer accepted the offer in the last campaign, 0 otherwise
Place
NumWebPurchases: Number of purchases made through the company’s website
NumCatalogPurchases: Number of purchases made using a catalogue
NumStorePurchases: Number of purchases made directly in stores
NumWebVisitsMonth: Number of visits to company’s website in the last month
2 - Feature Engineering and Data Cleaning
Drop null values
Convert Dt_Customer dtype to date
Create Dt_Collab column
Delete outlier (vampires in this case :D) datapoints based on Age column
Create Age Column (age of each customer in unti 2021)
Simplifying Education categories
Simplifying Marital_Status.
Labeling categorial columns
Create Children Column (Number of children that customers have).
Create FamilySize column (Number of family members of customers)
Create TotalSpent column (The total spents on products (wine,fruits,meat,fish,sweets,gold) that the customer has made during last 2 years)
Delete outlie datapoints based on Income column
Create TotalPromotions column (The total promotions user acceped in last 2 years)
Crate TotalPurchases column (The total number of purchases made by the customer in last two years)
Create CollabTime column (How long has it been since user registration)
Drop unneeded columns
Check Correlation between variables
Standard Scaling Features
3 - Apply Dmensionality Reduction
Apply PCA
Put PCA Output Into a Dataframe
Visualize reduced dimension Data
4 - Apply Clustering
Select the right value of k for clustring
Fit reduced dimension data into Kmeans
Visualize clusterd data (kemans output)
5 - EDA clusters
Whats the total members of each cluster ?
What is the spent of the members of each cluster compared to their income ?
Members of which cluster accepted more offer in the campaigns ?
Whats the number of family members of customers in each cluster ?
Number of children of each cluster ?
Which way do the members of each cluster buy more ?
Whats the age situation in each cluster ?
Number of purchases in each cluster ?
What are each cluster interested in buying ?
How is marital status in each cluster ?
What is the status of each cluster in terms of education ?
Which cluster showed more interest in discount ?
6 - Profiling Customers & Summarizing Report
Examples :
-86b33d42.png)
.png)
.png)
.png)


