Scraping and Dashboarding My Travel History from a Ride-Hailing Application
Snapp! is an Iranian service provider, allowing users to book a car and driver to transport them in a way similar to a taxi. Snapp is currently the most popular online taxi rental service in Iran, so I decided to analyze my use of this popular service.
Project Overview :
1 - Collecting Data :
Since Snapp did not have an api or source to receive data related to my travel history. I used a bot to collect my data from the snapp web app
What data did I collect ?
- Number of travels
- Total Hours of travels
- Total kilometers traveled
- Travel day title
- Car that i traveld with
- Travel cost
- Travel date
- trave time (hour)
- Initial point of travel
- Travel destination
- How many star were my travel
2 - Preprocess and Feature engineering collected data :
- Drop canceld travels
- Extract destination location from data
- Extract origin city (translated in english)
- Extract date and convert it form jalali (persain date unit into gregorian)
- Translate car model in English
- Convert travel cost from rial to toman and translate it (English)
- Split Curreny from price
- Drop uneeded columns
- Save data into csv file
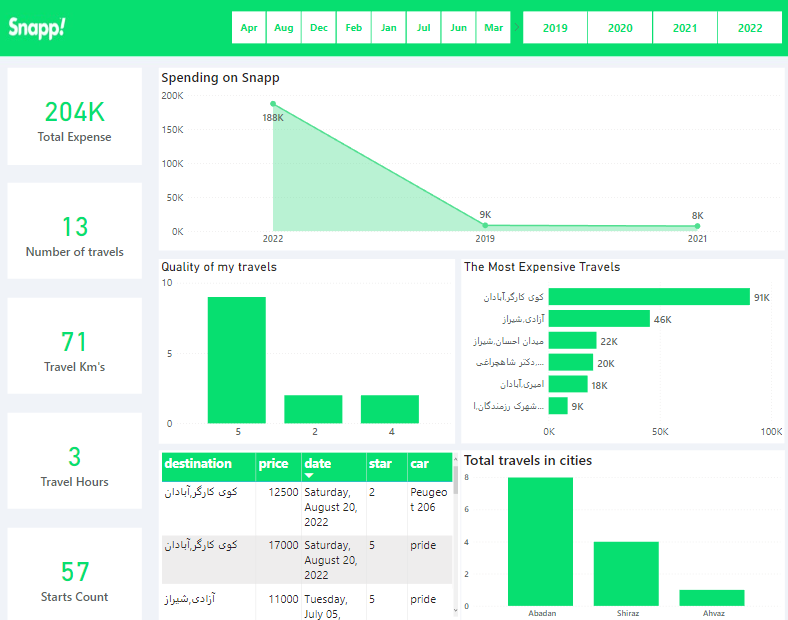
3 - Creating the dashboard using Power BI
For creating dashboard i used Power BI an powerful tool and interactive data visualization software product developed by Microsoft
What i persented in my dashboard :
- Total Expense of travels
- Total Hours of travels
- Total kilometers traveled
- Total stars givin
- Total cost of travels (dynamic in year and month)
- Quality of my travels (How many stars were my tavels mostly ?)
- Where was the most expensive travels for me ?
- In which cities did I use snapp the most ?
- My travels table (all of my travels (dynamic by sorting) )


